Catherine Chang — NBA Referee Stats
Catherine Chang averages 12.0 calls per game across 1 games in our historical sample: 4.00 on home teams and 8.00 on visitors.
Individual calls attributed to the official, not the full crew’s totals. Historical samples exclude preseason.
Sample dates: 2026-11-01 to 2026-11-01. How calls per game are calculated.
Explore the full referee dashboard
These charts require a subscription. See the same dashboard free on Scott Foster’s profile.
No account needed for the example. This official’s summary below is free.
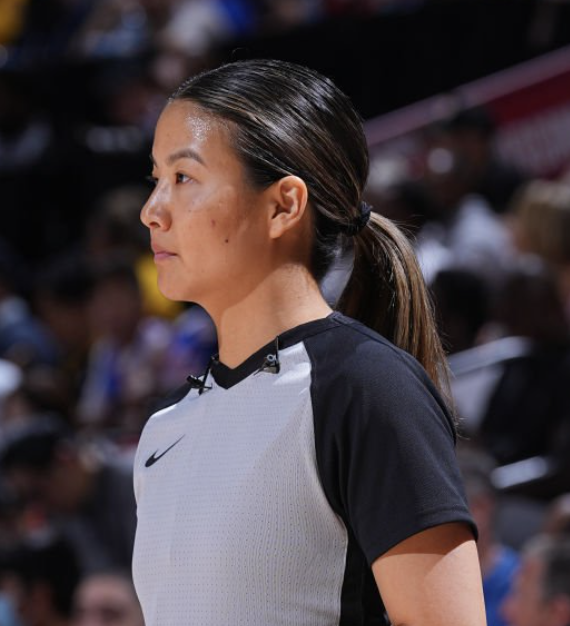
Catherine Chang
Select official
Catherine Chang: home vs. visitor calls
Average fouls called on each side per game
1 games. Bars start at zero and share a scale. These are individual calls, not crew totals or an accuracy rating.
Compare with other officials →ATS cover rate
Compare the official’s ATS cover rate with other referees.
View this chart free → Scott Foster example · No account neededATS performance by team
Compare how often each team covered the spread in this official’s games.
View this chart free → Scott Foster example · No account neededO/U over rate
Compare the share of games finishing over the total with other officials.
View this chart free → Scott Foster example · No account neededOver/under performance by team
Explore over/under results for each team in the sample.
View this chart free → Scott Foster example · No account neededFoul type distribution
See the mix of foul types attributed to the official.
View this chart free → Scott Foster example · No account neededPosition-based fouls
Explore which player positions received foul calls.
View this chart free → Scott Foster example · No account neededTeam foul call differential
Compare foul-call differences across teams.
View this chart free → Scott Foster example · No account neededFouls called for vs on
Compare fouls benefiting each team versus fouls assessed against them.
Compare calls on home and visiting teams.
View this chart free → Scott Foster example · No account neededFouls called for vs on by team
Explore each team’s calls for and against.
View this chart free → Scott Foster example · No account neededHome-away foul call differential by team
Compare team foul differences at home and away.
View this chart free → Scott Foster example · No account neededTeam foul call differential volatility
See how much foul counts vary across games.
View this chart free → Scott Foster example · No account neededAvg foul call differential vs volatility
Bubble size scales with games officiated.
Compare the size and variability of team foul differences.
View this chart free → Scott Foster example · No account neededFouls on home vs away teams
See how foul calls are distributed through the game.
View this chart free → Scott Foster example · No account neededHome score margin when fouls happen
Explore foul calls at different score margins.
View this chart free → Scott Foster example · No account neededHome foul count differential when fouls happen
Positive means the home team already has more fouls.
Explore calls at different team foul differentials.
View this chart free → Scott Foster example · No account neededHow to read these referee statistics
Foul rates and team splits
Calls per game counts each foul attributed to the official once. Home and visitor splits identify the team penalized. Compare sample sizes alongside rates: a small sample can swing sharply after a single game.
ATS and over/under charts
ATS means against the spread; over/under compares the final total with the betting line. These charts describe results in games the official worked. They do not isolate the official’s effect or guarantee a future result.
Put the numbers in context
Team styles, opponents, and game situations also influence fouls. A difference between home and visitor calls is not a measure of officiating accuracy or proof of bias.
Read our referee analysis methodology → Compare all NBA officials → Explore matchup analysis →